Following the trajectory of the pandemic and forecasting its evolution is of vital importance to plan public health measures. The key epidemiological parameters are estimated by using figures of case numbers, hospitalisations and deaths.qPCR tests, although generally interpreted as simply positive or negative, give a semi-quantitative result in the form of number of amplification cycles (Ct), inversely proportional to the viral load (quantity of the viral genome detected in a patient). With viral load values, it is possible to evaluate at an individual level the clinical severity of the illness or its transmissibility. Researchers at Harvard University (Boston, USA), who use these Ct values globally in testing platforms, have recently shown that changes in the Ct value distribution may reveal an epidemiological phenomenon such as the emergence of a new variant.
The researchers initially simulated infection cases so as to recreate viral load values during an epidemic. Their first observation was that at the beginning of the epidemic, infection cases increase rapidly and the majority seem to result from recent exposure. Conversely, as the epidemic subsides, the rate of new infections decreases as distance from the time of exposure increases.
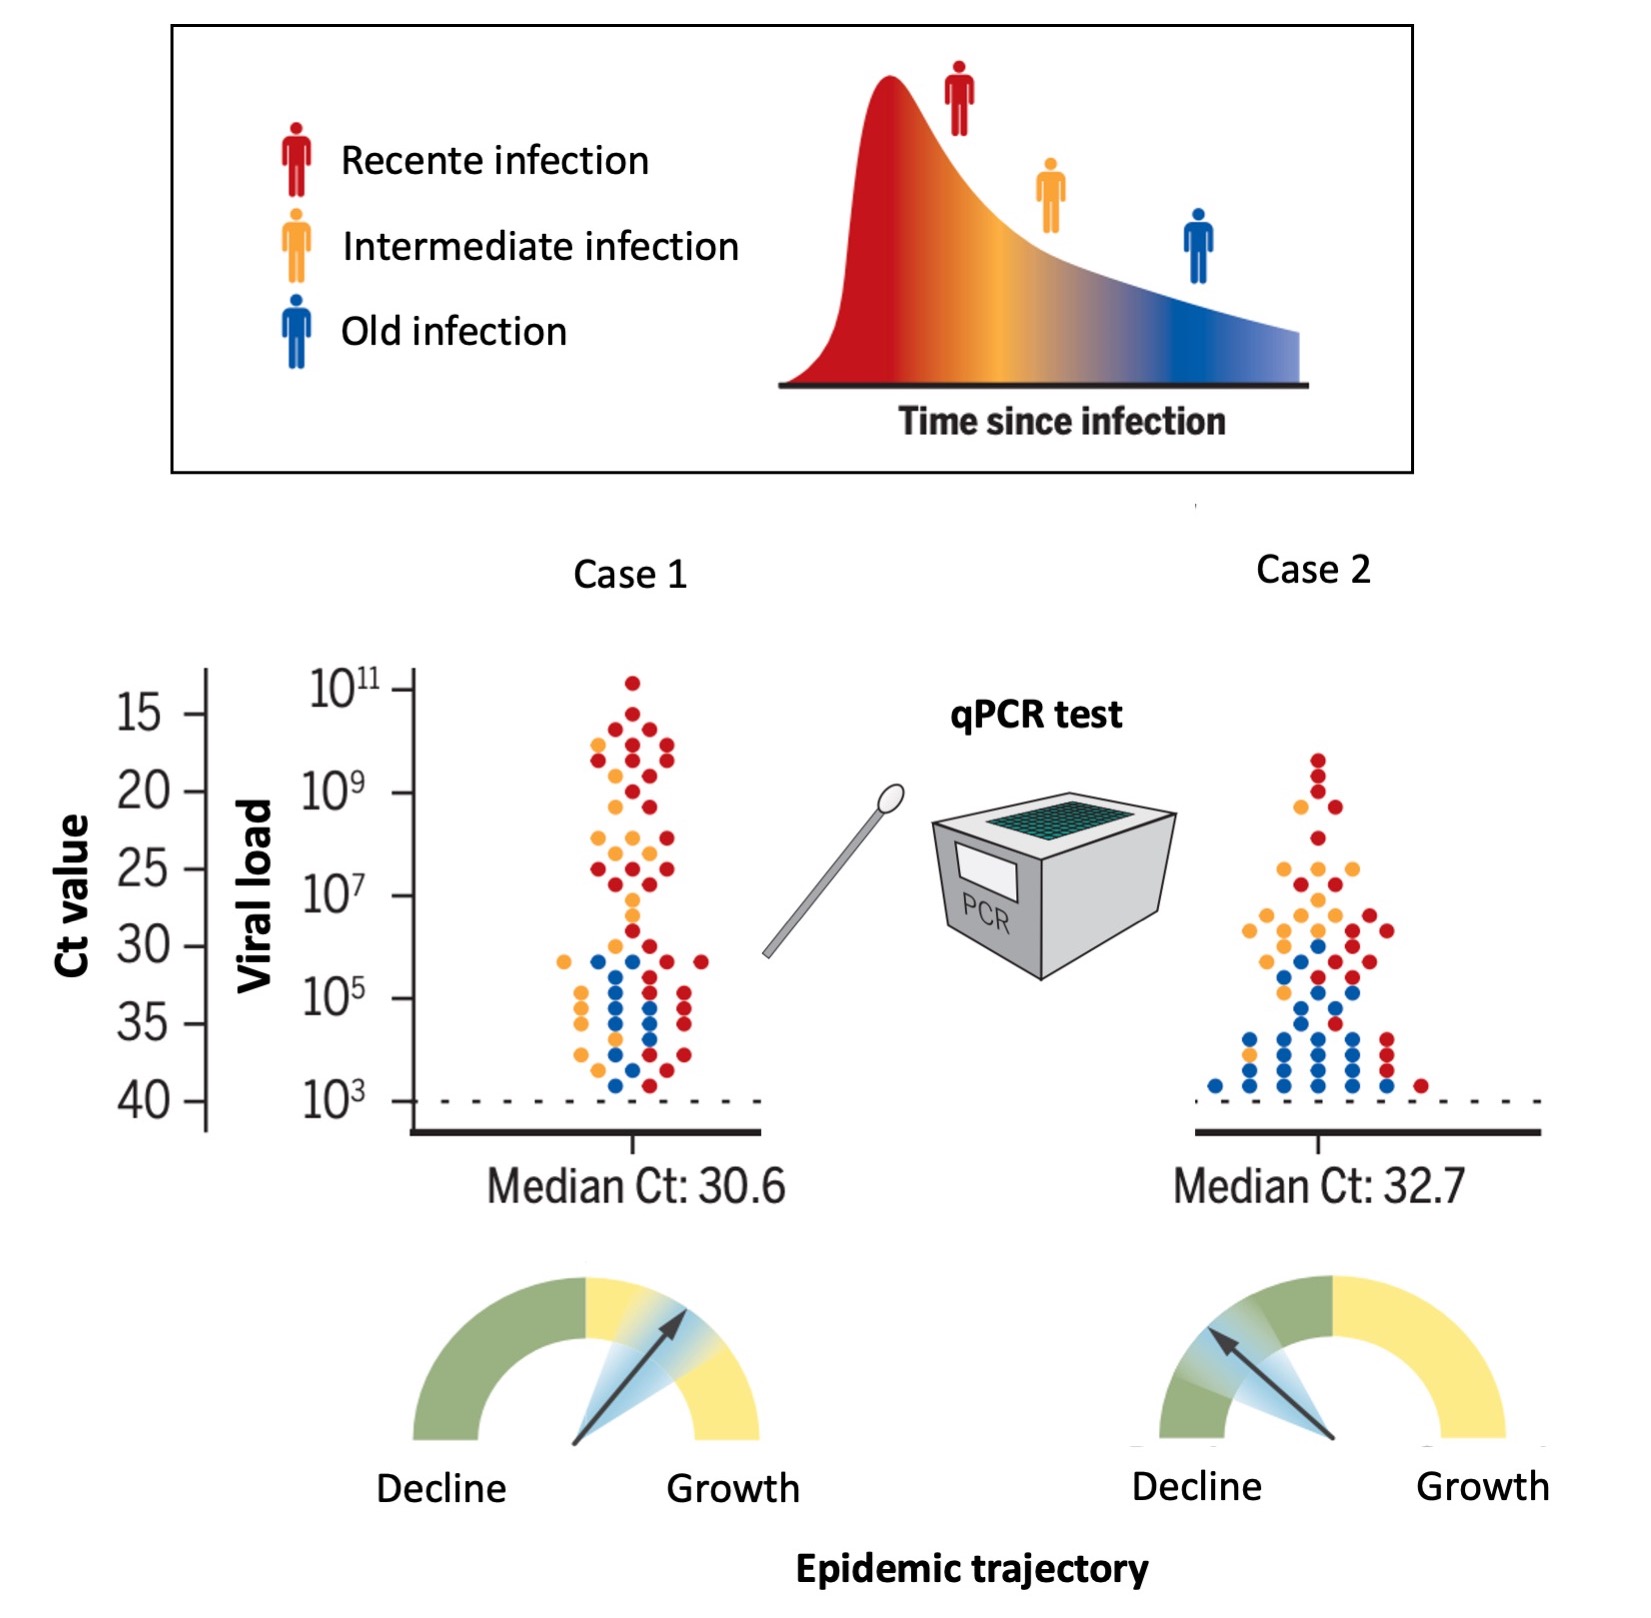
Although the moment of infection is an unobservable event, we can make a link between the viral load (and thus Ct values in qPCR tests) and the time that has elapsed since the moment of infection in the individual: a peak viral load can be observed during the initial phase of the infection, and the further we move away this initial infection, the weaker the viral load becomes. The scientists were thus able to conclude, using mathematical modelling, that at a population level, during the active phase of the epidemic (as infections increase), there were many recent infections and, as a result, many instances of high viral load (and therefore low Ct). On the contrary, as the epidemic slows, infections are older and viral loads lower (and therefore Ct levels are higher).
The researchers confirmed the validity of this method by using data from pPCR tests from the state of Massachusetts, reproducing the estimations obtained from other sources. This model enabled the dynamic of the epidemic within a homogenous population, where the date of the beginning of the epidemic was known, to be studied. But for more complex populations, the scientists were able to formulate another mathematical model which also allowed the evolution of the epidemic to be predicted.
Until this time, Ct values, semi-quantitative results from qPCR COVID-19 tests, have been used only to evaluate the clinical state of individuals. But these scientists have been able to establish a new predictive model of the epidemic based on the cumulation of Ct values within a population. This makes it possible to limit statistical bias by taking into consideration only numbers of new cases or deaths, which are dependent on testing capacity or results.